주요 역할
● Prometheus - 쿠버네티스로부터 데이터를 수집하는 시스템
● Grafana - 수집한 데이터를 시각화 해주는 시스템

1. Helm 설치
● helm은 쿠버네티스 차드를 관리를 위한 도구(리눅스의 dnf, yum과 같은 패키지)
● 공식 홈페이지를 참고했습니다.
아래 명령어 실행(Master-node)
[root@k8s-master ~]# curl -fsSL -o get_helm.sh https://raw.githubusercontent.com/helm/helm/main/scripts/get-helm-3
[root@k8s-master ~]# chmod 700 get_helm.sh
[root@k8s-master ~]# ./get_helm.sh
2. Prometheus & Grafana 설치
Repository 추가
[root@k8s-master ~]# helm repo add prometheus-community https://prometheus-community.github.io/helm-charts
[root@k8s-master ~]# helm repo update
Namespace 생성
[root@k8s-master ~]# kubectl create namespace monitoring
Prometheus & Grafana 설치
[root@k8s-master ~]# helm install prometheus prometheus-community/kube-prometheus-stack --namespace monitoring

[root@k8s-master ~]# kubectl --namespace monitoring get pods -l "release=prometheus" ## 설치 확인

3. pod 접근 설정
Nodeport 설정
[root@k8s-master ~]# kubectl edit svc prometheus-grafana --namespace monitoring

4. 사이트 접속
접속 확인

● 제가 접속한 IP는 virtualbox 에서 포트포워딩을 해준 상태라서 그러니 참고만 하시기 바랍니다.
● 기본 계정은 admin, 패스워드는 prom-operator 입니다.

정상 접속 화면
5. 모니터링 설정
Dashboard 설정

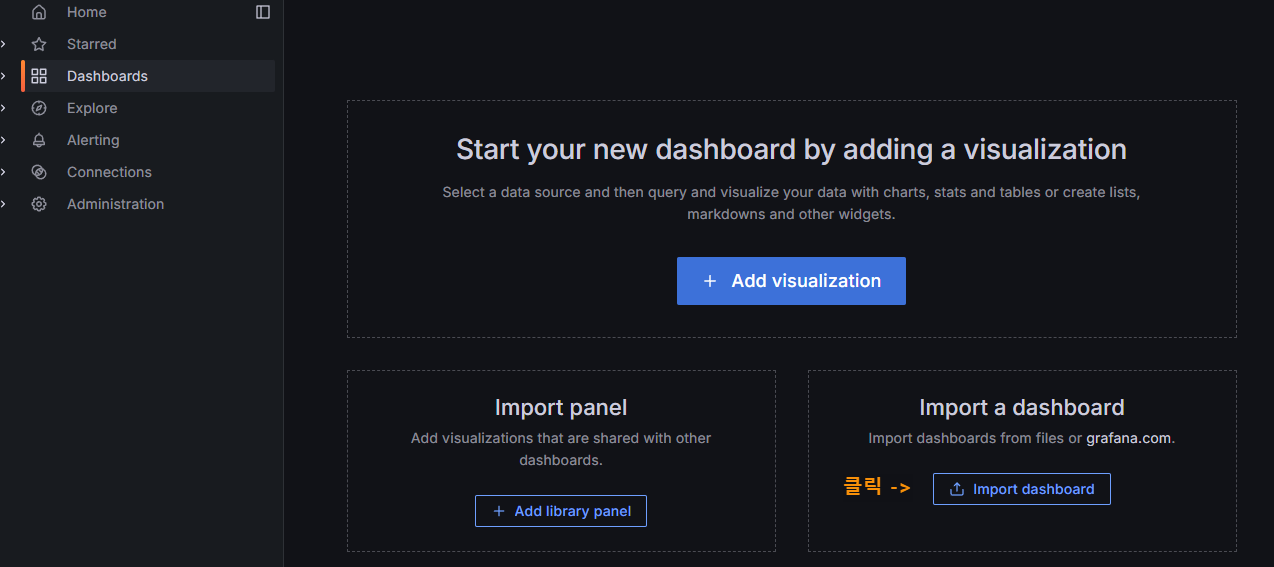
Cluster Monitoring for Kubernetes | Grafana Labs
● 위 사이트 접속해서 Copy ID to clipboard 클릭


설정된 대시보드 화면
'IT > Kubernetes' 카테고리의 다른 글
| [Kubernetes/쿠버네티스] pod 동작 flow (0) | 2024.07.23 |
|---|---|
| [kubernetes/쿠버네티스] nginx 서버 배포하기 (0) | 2024.07.05 |
| [kubernetes/쿠버네티스] 명령어 자동완성 설정 (0) | 2024.06.21 |
| [kubernetes/쿠버네티스] pod 관리 명령어 (0) | 2024.06.21 |
| [Kubernetes/쿠버네티스] 설치, 구축하기 (0) | 2024.06.14 |